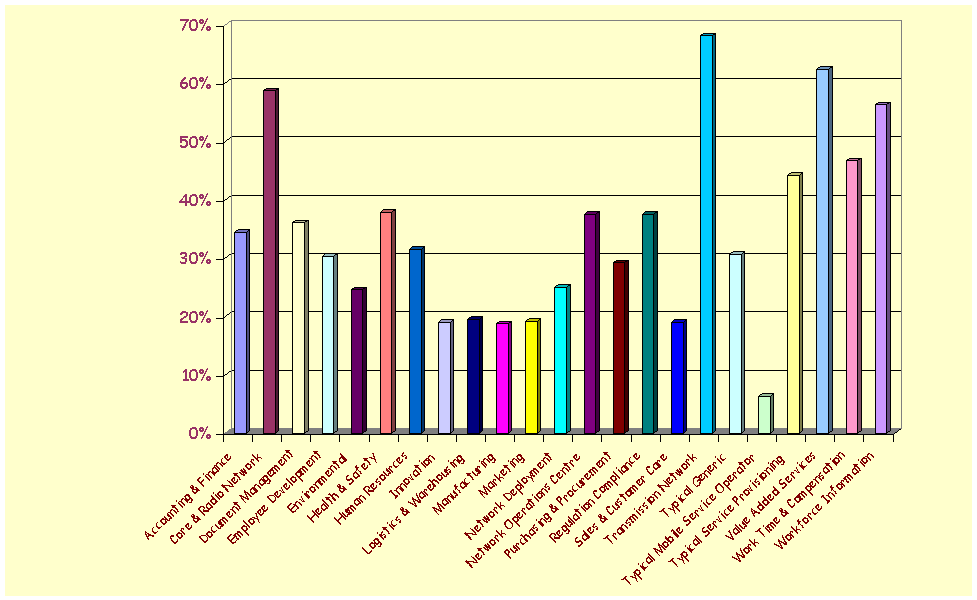

| This graph represents the completeness of KPI data held on or referenced by the tool used to build the individual functional descriptions. It is not a "like-for-like" representation as each functional area not only has a different number of KPIs, not all data is relevant to every KPI, so in many cases, using the chosen methodology, 100% completeness will not be attainable. Furthermore, the absolute numbers will constantly change as the site evolves and more details are added to the tool database. This reflects accurately KPI evolution in the "real world". | E-Mail Us Front Page KPI Portal |